Research Highlights
Multicolor Electron Microscopy Used to Visualize Multiple Molecular Components Inside a Cell
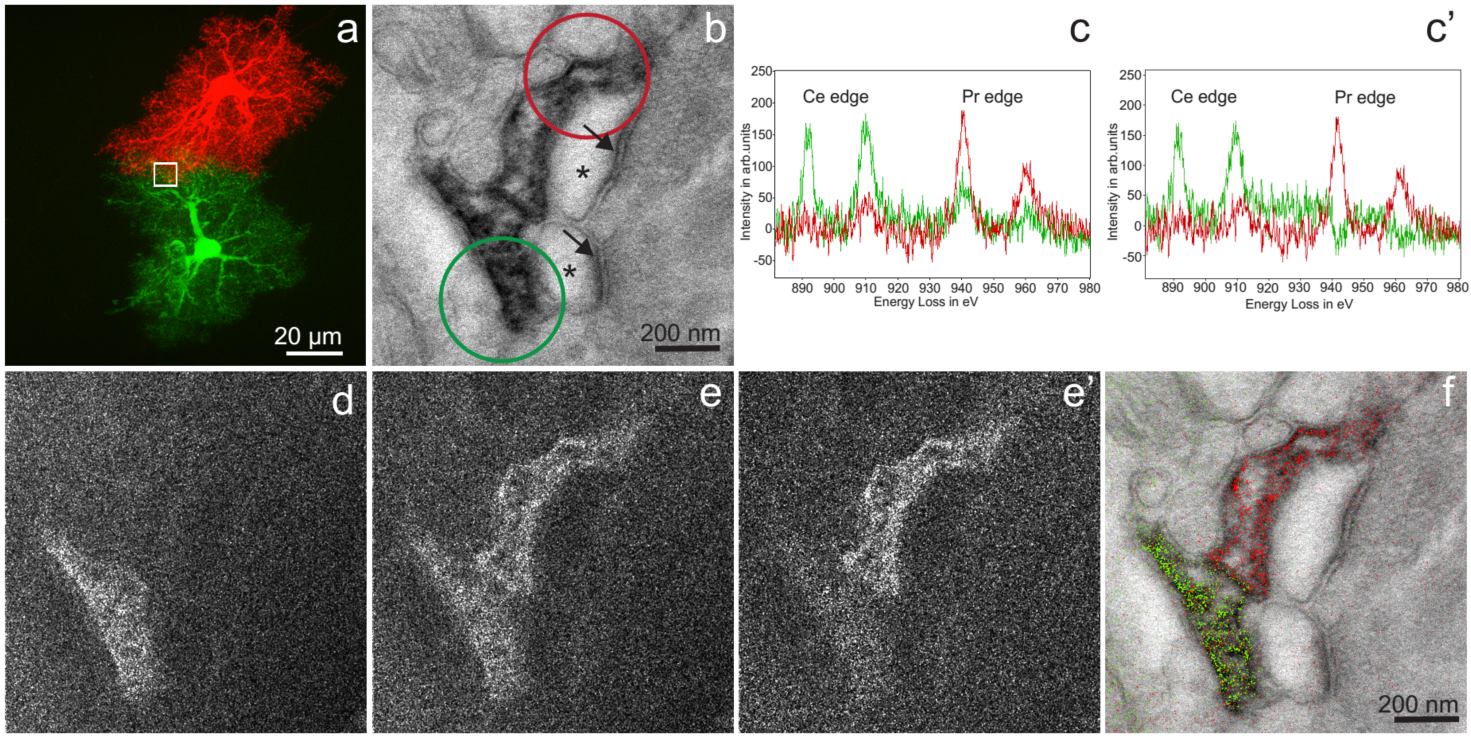
Two-color EM of Hippocampal Astrocytes in Brain Slices: a) Correlative fluorescent image of adjacent hippocampal astrocytes injected with Lucifer yellow or neurobiotin/Alexa 568. The white box is the approximate region of the EM acquisition, shown in the following panels. b) Conventional TEM image (x 15000, 0.56 nm/pixel) showing astrocyte processes containing precipitated Ce- and Pr-DAB2 complexes contacting two spines synapsing (asterisk) with a bouton (PSDs indicated with arrows). c) EELS spectra obtained at the lower astrocyte (green spectra) photooxidized with Ce-DAB2 and upper astrocyte (red spectra) HRP enzymatically reacted Pr-DAB2; the respective regions are shown as circles in b. The upper astrocyte contains predominately Pr, whereas the bottom has Pr and Ce signals. c’) The cross-talk in the spectra shown in c, due to Pr-DAB2 attaching to regions labeled with Ce-DAB2 has been mathematically subtracted. d) & e) Ce and Pr elemental maps (x 25000; five window method using a sum of 19 drift-corrected 50 s exposures per window). e’) Corrected Pr map, removing Pr-DAB from regions with Ce-DAB. f) Two-color merge of the spectrally-separated elemental maps (green for Ce and red for Pr) overlaid on a conventional image, showing the two different astrocyte processes contacting the same synapse.
03-11-2016 La Jolla, CA
Electron microscopy (EM) is the primary method to image biological cellular ultrastructure, though it has not been possible to label and distinguish different kinds of molecules in a single image. The research described here developed and applied a method to image multiple subcellular components, distinguished by individual colors, at the same time.
The method used photosensitizers, small-molecule probes, and peroxidases to locally deposit different lanthanides inside a cell, a particular lanthanide for each unique component being targeted. Electron energy-loss spectroscopy and energy-filtered EM then were used to visualize the distinctive spectra of the different lanthanide deposits. The resulting elemental maps then were overlaid computationally on a conventional greyscale EM image of the same tissue sample to show multicolor labeling of the components.
The result was multicolor EM images analogous to multicolor fluorescence in light microscopy but leveraging the full spatial resolution of EM. Joe Caputo, from Cell Chemical Biology, the journal publishing this research, described the images as “striking visuals.”
This work builds on the legacy of Roger Y. Tsien, one of the paper’s senior authors, who died August 24. Tsien won the Nobel prize in Chemistry in 2008 for his groundbreaking work applying green fluorescent proteins from jellyfish as research tools. He mutated the gene that encodes the protein so that the protein glowed brightly under blue light in traditional light microscopy, thereby making it possible to track a particular protein and its movements inside a cell. Then he developed a full color palette to track several different proteins at the same time. These basic research ideas now find realization, though this project, in electron microscopy, which benefits from up to 100x higher magnification and, hence, much higher spatial resolution.
Up until this research, researchers have used in situ oxidation of diaminobenzidine (DAB) as the go-to method to generate a precipitate to surround and stain a target protein. This method makes it possible to label specific proteins without damaging the larger cellular ultrastructure. But the problem is that such stained proteins may not be easily distinguishable from other cellular structures, such as membranes, stained, for example, with osmium or other heavy metals used to provide contrast in EM.
The work described here, by contrast, demonstrates a method that can differentiate the DAB precipitate from other stained cellular components. Moreover, it enables identifying and imaging successively deposited DAB at targeted proteins.
The key to this method is to precipitate DAB conjugated to lanthanide chelates (rather than DAB itself), which deposits a specific metal such as Ce3+. After one deposit is made by photooxidation), the unreacted DAB-chelator-Ln is washed out, and another DAB-chelator bound to a different lanthanide ion such as Pr3+ is deposited (via photooxidation at wavelengths that do not excite the first deposit, or by a peroxidase plus hydrogen peroxide). Using EM, the two precipitates can then be spectrally separated using electron energy-loss spectroscopy (EELS) and the resulting “elemental maps” reveal their spatial distribution. These maps can be overlaid on a standard electron micrograph to superimpose their colored locations on the cellular ultrastructure.
The first step in the project was to design metals complexed to DAB that precipitate when photooxidized and that form high-affinity chelates to prevent loss of metal ions during DAB oxidation and subsequent processing. The lanthanide series was chosen because the series’ ions have similar charge and ionic radii, produce suitable EELS signals, and were expected to bind to a conjugate of DTPA with DAB (DTPA-DAB2) that was synthesized. Then DTPA-DAB2 was complexed to various lanthanide ions (Ln3+) to form Ln-DAB2.
The researchers next tested whether two different Ln-DAB2 could be precipitated in cells and whether the EELS signals of the two metals could be detected and distinguished from each other.
The next step was to determine the best way to visually combine the two lanthanide maps with a conventional TEM image. They first tried “mixing” (in Photoshop) the conventional TEM in grayscale with the lanthanide maps in red and green. But the black pixels in the greyscale image drowned out the color. After a series of trial-and-error experiments, they realized that the conventional TEM image has high spatial frequencies, resolution, and signal to noise, analogous to the luminance channel in television, whereas the colors needed to be displayed as lower-resolution overlays. So they applied a custom algorithm to generate pseudocolored overlays of the La and Ce elemental maps on the monochrome EM image to produce a two-color representation of the markers. An advantage of this algorithm is that it can be generalized to a greater number of colors, which, in turn, can be used to label a greater range of proteins.
They applied this method to biological questions that required the ultrastructural resolution of EM and labeling of two cell components: One candidate was protoplasmic astrocytes in the mouse hippocampus. This method revealed that processes from two astrocytes can share a single synapse.
The researchers are working to heighten the sensitivity of this approach by increasing the amount of lanthanide deposited during oxidation of the Ln-DAB chelates. Further development should lead to greater understanding of the relationship between structure and metal deposition and improve the signal-to-noise ratio, decrease acquisition time and sample damage, and potentially enable even greater resolution.
Funding Source: S.P.L. was supported by the UC San Diego (UCSD) Graduate Training Program in Cellular and Molecular Pharmacology (T32 GM007752) and Graduate Training Program in Neuroplasticity of Aging (T32 AG000216). This work was also supported by NIH GM103412 (M.E.) and NIH GM086197 (R.T.).
Relevant Publication: Adams, Stephen R., Mason R. Mackey, Ranjan Ramachandra, Sakina F. Palida Lemieux, Paul Steinbach, Eric A. Bushong, Margaret T. Butko, Ben N.G. Giepmans, Mark H. Ellisman, and Roger Y. Tsien, “Multicolor electron microscopy for simultaneous visualization of multiple molecular species,” Cell Chemical Biology, November 17, 2016, pp. 1-11, http://dx.doi.org/10.1016/j.chembio.2016.10.006.